conclusion of the three part series
on statistical significance (previous
posts here:
https://douglasadowning.wordpress.com/2019/04/04/statistics-and-cards-are-queens-more-likely-to-be-red/
and here:
https://douglasadowning.wordpress.com/2019/04/06/statistics-and-cards-2-the-problem-with-significance/
A larger sample always helps when
performing statistical analysis, but
a larger sample doesn’t solve the
issue discussed here. If you test
100 null hypotheses that are all true
at the 5 percent significance level,
you will likely incorrectly reject
5 of those hypotheses. This
property follows from the definition
of the 5 percent significance level,
and does not depend on the sample
size.
For example, suppose you have a sample
of 1,000 queens and find 523 red cards,
and you have a sample of 1,000 fives
with 477 red cards. Calculating the
test statistic Z:
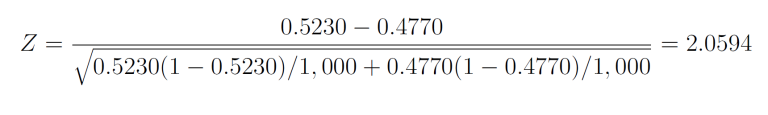
Z is greater than 1.96, so we can
say there is a statistically significant
difference, and queen cards are more likely
to be red than five cards.
You might possibly think this result would
be very unlikely, but there is about a 15
percent chance that out of 1,000 cards
drawn the number of red cards would be
23 more than 500, or 23 less than 500.
If you test a lot of hypotheses
you will have this type of result
happen some times (but unlike the case
with the cards, you won’t know what
the population is like so you won’t know
that your sample misrepresents the population).
It also helps to check the p value.
A p value just slightly below 0.05 indicates
that the null hypothesis is just barely
rejected. A very small p value provides
a strong indication that the null hypothesis
really should be rejected and it’s not just
a fluke of random chance. Even so it would
still help to see the result replicated by
other researchers to show that no systematic
bias was involved in the original procedure.
A large sample is good because it allows you
to make a more precise estimate about the
population. That makes it easier to tell
if two quantities from different populations
really are different even if the values are
close to each other. However, that’s the
issue: two values can be shown to be different
by statistical analysis of large samples
even if those two values are very close
together. The values may be different,
but the difference is too small to be
important. When hearing of a statistically
significant difference you should take the
common-sense step of checking to see if the
reported difference really is very big or not.
In our case, we know
there really is zero difference, since
exactly half of the fives and half
of the queens are red cards.
Even though our result is “statistically
significant” it is just plain wrong.
……………..
–Douglas Downing
You are welcome to write your comments on the facebook page at
https://www.facebook.com/DouglasADowningSPU/?ref=profile
This blog is part of the
Seattle Pacific University Political Economy blog group
(click here for index)
Click here for the index of topics for the blog
Twitter:
https://twitter.com/douglasdowning
New items are posted about twice per week.
